Document Insights
Last updated: July 9, 2025
If you prefer, you can watch the video walkthrough instead. If not, follow along below.
Understand how your SOPs are being used across your organisation.
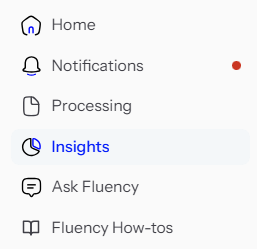
What You Can Track
Fluency’s Insights tab gives you high-level and granular visibility into SOP consumption:
Documents Created – Total count of new documents
Mean Steps – Average number of steps per document
Total Document Views – Cumulative view count across all documents
Unique Viewers – Number of individual users accessing your content
Organisation Trends
See trends over time:
View activity spikes
Track changes in total vs. unique engagement
Filter by timeframe (e.g., last 30 days)
Individual Document Trends
Drill down into specific documents to:
View per-document trends
See how often each SOP is being accessed
Compare total and unique views for performance validation
Coming Soon
We're expanding this view to include:
Viewer-level insights: Who's accessing what
Completion metrics: How far users are progressing